FID            1000 non-null    환자 아이디
IID            1000 non-null    환자 아이디
AGE_B          1000 non-null    나이
SMOK_B         990 non-null     흡연 여부 1:비흡연, 2: 과거 흡연, 3: 흡연자
SMOKA_MOD_B    679 non-null     하루 평균 흡연량 (nan -> 0으로 전처리)
ALCO_B         965 non-null     음주 여부 1: 예, 2: 아니오, nan : ?
ALCO_AMOUNT_B  915 non-null     1회당 잔수로 환산 ...?
EXER_B         927 non-null     1: 예, 2: 아니오
MDM_B          46 non-null      . 데이터가 적음
MHTN_B         120 non-null     . 데이터가 적음
MLPD_B         28 non-null      . 데이터가 적음
PHTN_B         153 non-null     . 데이터가 적음
PDM_B          67 non-null      . 데이터가 적음
PLPD_B         36 non-null      . 데이터가 적음
HT_B           998 non-null     신장
WT_B           998 non-null     체중
WAIST_B        971 non-null     허리둘레 (필요없을 듯)
SBP_B          988 non-null     수축기혈압
DBP_B          989 non-null     이완기혈압
CHO_B          995 non-null     총 콜레스테롤
LDL_B          995 non-null     저밀도 콜레스테롤
TG_B           995 non-null     중성지방
HDL_B          987 non-null     고밀도 콜레스테롤
FBS_B          998 non-null     공복혈당
GOT_B          996 non-null     AST(GOT)
GPT_B          996 non-null     ALT(GPT)
GGT_B          992 non-null     r_GTP
URIC_B         929 non-null     요산(Uric acid)
------------------------------------------------------
PCAN80         4 non-null      . 데이터가 적음
PCAN81         15 non-null     . 데이터가 적음
PCAN82         0 non-null      . 데이터가 적음
PCAN83         1 non-null      . 데이터가 적음
PCAN84         8 non-null      . 데이터가 적음
PCAN86         4 non-null      . 데이터가 적음
PCAN89         18 non-null     . 데이터가 적음
FCAN80         30 non-null     . 데이터가 적음
FCAN81         69 non-null     . 데이터가 적음
FCAN82         1 non-null      . 데이터가 적음
FCAN83         23 non-null     . 데이터가 적음
FCAN84         20 non-null     . 데이터가 적음
FCAN86         35 non-null     . 데이터가 적음
FCAN89         11 non-null     . 데이터가 적음

FEV1           569 non-null   800초과 (이상치 처리하여 null값된 느낌)
FVC            569 non-null   비슷한 이유로 위와 같다고 생각.
BIL            948 non-null   총빌리루빈(T-bilirubin)
WBC            928 non-null   백혈구(WBC)
CREAT          962 non-null   크레아티닌(Creatinine)
STOMA          1000 non-null  암
COLON          1000 non-null  암
LIVER          1000 non-null  암
LUNG           1000 non-null  암
PROST          1000 non-null  암
THROI          1000 non-null  암
BREAC          1000 non-null  암
RECTM          1000 non-null  암
SCOLON         1000 non-null  암 관련 수치
SRECTM         1000 non-null  암 관련 수치
SPROST         1000 non-null  암 관련 수치
STHROI         1000 non-null  암 관련 수치
SBREAC         1000 non-null  암 관련 수치
SLUNG          1000 non-null  암 관련 수치
SSTOMA         1000 non-null  암 관련 수치
SLIVER         1000 non-null  암 관련 수치
SEX1           1000 non-null  1 : 남자, 2 : 여자
CRC            1000 non-null  모르겠다.
SCRC           1000 non-null  암 관련 수치
df=data.loc[:,['PCAN80', 'PCAN81', 'PCAN82', 'PCAN83', 'PCAN84', 'PCAN86', 'PCAN89',
       'FCAN80', 'FCAN81', 'FCAN82', 'FCAN83', 'FCAN84', 'FCAN86', 'FCAN89']]
print(df.isnull().sum())
위 사진을 보면 null값이 대부분이기 때문에 drop하는 것이 낫다고 생각했다.
'MDM_B', 'MHTN_B', 'MLPD_B', 'PHTN_B', 'PDM_B', 'PLPD_B' -> null 값이 많이 나오기에 drop하였다.
df=data.loc[:,['SCOLON', 'SRECTM', 'SPROST', 'STHROI', 'SBREAC', 'SLUNG', 'SSTOMA', 'SLIVER', 'SCRC']]
df

'SCOLON', 'SRECTM', 'SPROST', 'STHROI', 'SBREAC', 'SLUNG', 'SSTOMA', 'SLIVER', 'SCRC' 까지 모두 암 관련 수치로 0과 1로 이뤄진 암 관련 변수들로 구분이 되므로 drop해도 된다고 생각하였다.
'FEV1', 'FVC'의 경우 이상치로 인해 569개의 데이터만이 남았고 따로 변수의 설명을 찾지 못해 drop하였다.
또한 'ALCO_AMOUNT_B','SMOKA_MOD_B' 의 경우 'ALCO_B'와 'SMOK_B'가 있기 때문에 양보다는 여부가 중요하다고 생각하여 drop하였다.
df.info()
train/test data set 분할
먼저 전체 데이터 프레임에서 타겟값을 제외한 나머지 columns X_df로 설정하고, LUNG을 y_df로 설정한다.
(폐암(LUNG)의 경우만을 살펴보았다.)
#폐암
features=['LUNG','STOMA','COLON','LIVER','LUNG','PROST','THROI','BREAC','RECTM']
y_df =df['LUNG']
X_df =df.drop(features, axis=1)
from sklearn.model_selection import train_test_split
X_train,X_test,y_train,y_test = train_test_split(X_df,y_df,test_size=0.2)예측한 결과값 중 다수의 분류기가 결정한 예측값을 최종 보팅 결과값으로 선정하는 하드 보팅(hard voting)과 분류기들의 레이블 값 결정 확률을 모두 더하여 이를 평균 내어 확률 값이 가장 높은 레이블을 최종 보팅 결과값으로 선정하는 소프트 보팅(soft voting)이 있다.
import matplotlib.pyplot as plt
import numpy as np
#분류 모델
from sklearn.tree import DecisionTreeClassifier
from sklearn.ensemble import RandomForestClassifier
from sklearn.linear_model import LogisticRegression
from sklearn.neighbors import KNeighborsClassifier
from sklearn.ensemble import VotingClassifier
from sklearn.ensemble import AdaBoostClassifier
from sklearn.metrics import confusion_matrix,classification_report #정오분류표
from sklearn.metrics import accuracy_score,precision_score,recall_score,f1_score,roc_auc_score #정확도,민감도
from sklearn.metrics import roc_curve, auc #ROC 곡선 그리기
#최적화
from sklearn.model_selection import learning_curve,validation_curve #학습곡선, 검증곡선
from sklearn.model_selection import GridSearchCV #하이퍼파라미터 튜닝
from sklearn.model_selection import cross_val_score #교차타당도 #추가투표 기법 사용
logistic = LogisticRegression(solver='liblinear',penalty='l2')
tree = DecisionTreeClassifier(max_depth=None,criterion='entropy')
knn = KNeighborsClassifier(n_neighbors=1,p=2,metric='minkowski')
forest = RandomForestClassifier()
adaboost = AdaBoostClassifier()
voting_estimators = [('logistic',logistic),('tree',tree),('knn',knn)]
voting = VotingClassifier(estimators=voting_estimators,voting='soft')
#소프트 보팅 이용 (분류기들의 레이블)
#투표 기법 사용
a_clf_labels = ['Logistic regression','Decision tree','KNN','Majority voting']
a_all_clf = [logistic,tree,knn,voting]

#배깅
b_clf_labels = ['Decision tree','Random forest']
b_all_clf = [tree,forest]

#부스팅
c_clf_labels = ['Decision tree','Ada boost']
c_all_clf = [tree,adaboost]
for clf, label in zip(a_all_clf,a_clf_labels):
scores = cross_val_score(estimator=clf,X=X_train,y=y_train,cv=10,scoring='roc_auc')
print('ROC AUC: %0.3f (sd : %0.3f),[%s]' %(scores.mean(),scores.std(),label))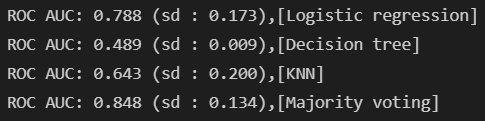
colors=['r','g','b','black']
for clf,label,clr in zip(a_all_clf,a_clf_labels,colors):
    clf.fit(X_train,y_train)
    y_pred = clf.predict_proba(X_test)[:,1]
    fpr,tpr,thresholds = roc_curve(y_true=y_test,y_score=y_pred)
    roc_auc=auc(x=fpr,y=tpr)
    plt.plot(fpr,tpr,color=clr,label='%s(auc=%0.3f)'%(label,roc_auc))

plt.legend(loc='lower right')
plt.grid()
plt.xlabel('False positive rate(fpr)')
plt.ylabel('True postivie rate (tpr)')
plt.show()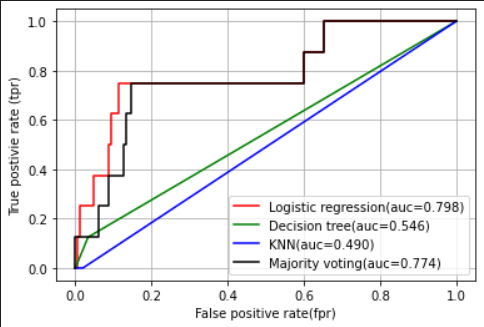
colors=['r','g']
for clf,label,clr in zip(b_all_clf,b_clf_labels,colors):
    clf.fit(X_train,y_train)
    y_pred = clf.predict_proba(X_test)[:,1]
    fpr,tpr,thresholds = roc_curve(y_true=y_test,y_score=y_pred)
    roc_auc=auc(x=fpr,y=tpr)
    plt.plot(fpr,tpr,color=clr,label='%s(auc=%0.3f)'%(label,roc_auc))

plt.legend(loc='lower right')
plt.grid()
plt.xlabel('False positive rate(fpr)')
plt.ylabel('True postivie rate (tpr)')
plt.show()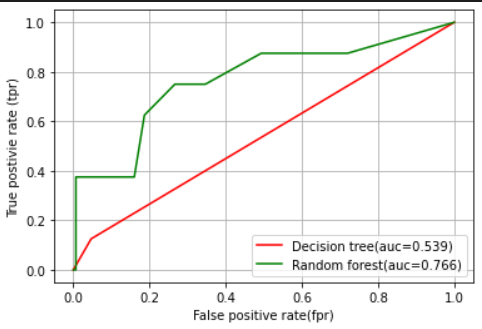
colors=['r','g']
for clf,label,clr in zip(c_all_clf,c_clf_labels,colors):
    clf.fit(X_train,y_train)
    y_pred = clf.predict_proba(X_test)[:,1]
    fpr,tpr,thresholds = roc_curve(y_true=y_test,y_score=y_pred)
    roc_auc=auc(x=fpr,y=tpr)
    plt.plot(fpr,tpr,color=clr,label='%s(auc=%0.3f)'%(label,roc_auc))

plt.legend(loc='lower right')
plt.grid()
plt.xlabel('False positive rate(fpr)')
plt.ylabel('True postivie rate (tpr)')
plt.show()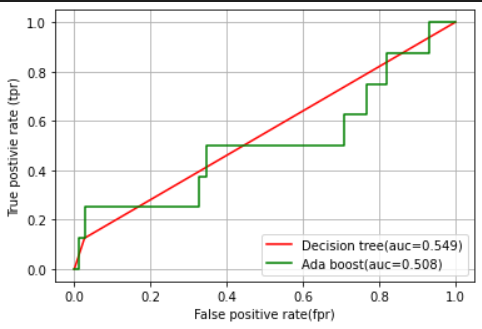
오류나는 이유 찾기.
# params ={'logistic__C':[0.001,0.1,100.0],
#          'tree__max_depth':[1,2,3,4,5],
#          'knn_n_neighbor':[1,2,3,4,5]}
# grid=GridSearchCV(estimator=voting,param_grid=params,cv=10,scoring='roc_auc')
# grid.fit(X_train,y_train)
# for r,_ in enumerate(grid.cv_results_['mean_test_score']):
#     print(grid.cv_results_['mean_test_score'][r],
#           grid.cv_results_['std_test_score'][r]/2.0,
# grid.cv_results_['params'][r])#print(grid.best_params_)feat_labels= X_df.columns
importance =forest.feature_importances_
indices=np.argsort(importance)[::-1]
for f in range(X_train.shape[1]):
print("%3d) %-*s %f" %(f+1,30,feat_labels[indices[f]],importance[indices[f]]))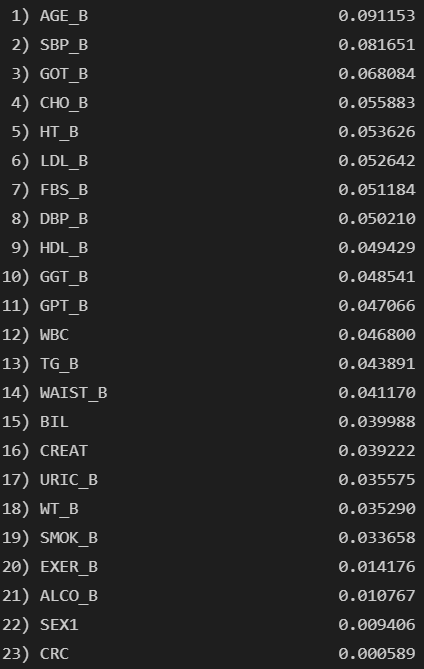
plt.bar(range(X_train.shape[1]),importance[indices],align='center')
plt.xticks(range(X_train.shape[1]),feat_labels[indices],rotation=45,size=8)
plt.title('feature importance')
plt.show()
'연구 활동 > 폐암 예측 프로젝트' 카테고리의 다른 글
| [2022 동계 인턴십]암예측 5 (0) | 2022.02.19 |
|---|---|
| [2022 동계 인턴십] WinSCP 사용법! (0) | 2022.02.19 |
| [2022 동계 인턴십]암예측 4 (0) | 2022.02.16 |
| [동계인턴십] 암 예측 2 (0) | 2022.01.11 |
| [2022 동계인턴십] 암 예측 (0) | 2022.01.10 |


